Research · Astrophysics
Can a Galaxy's Spectrum Tell You Where It Lives?
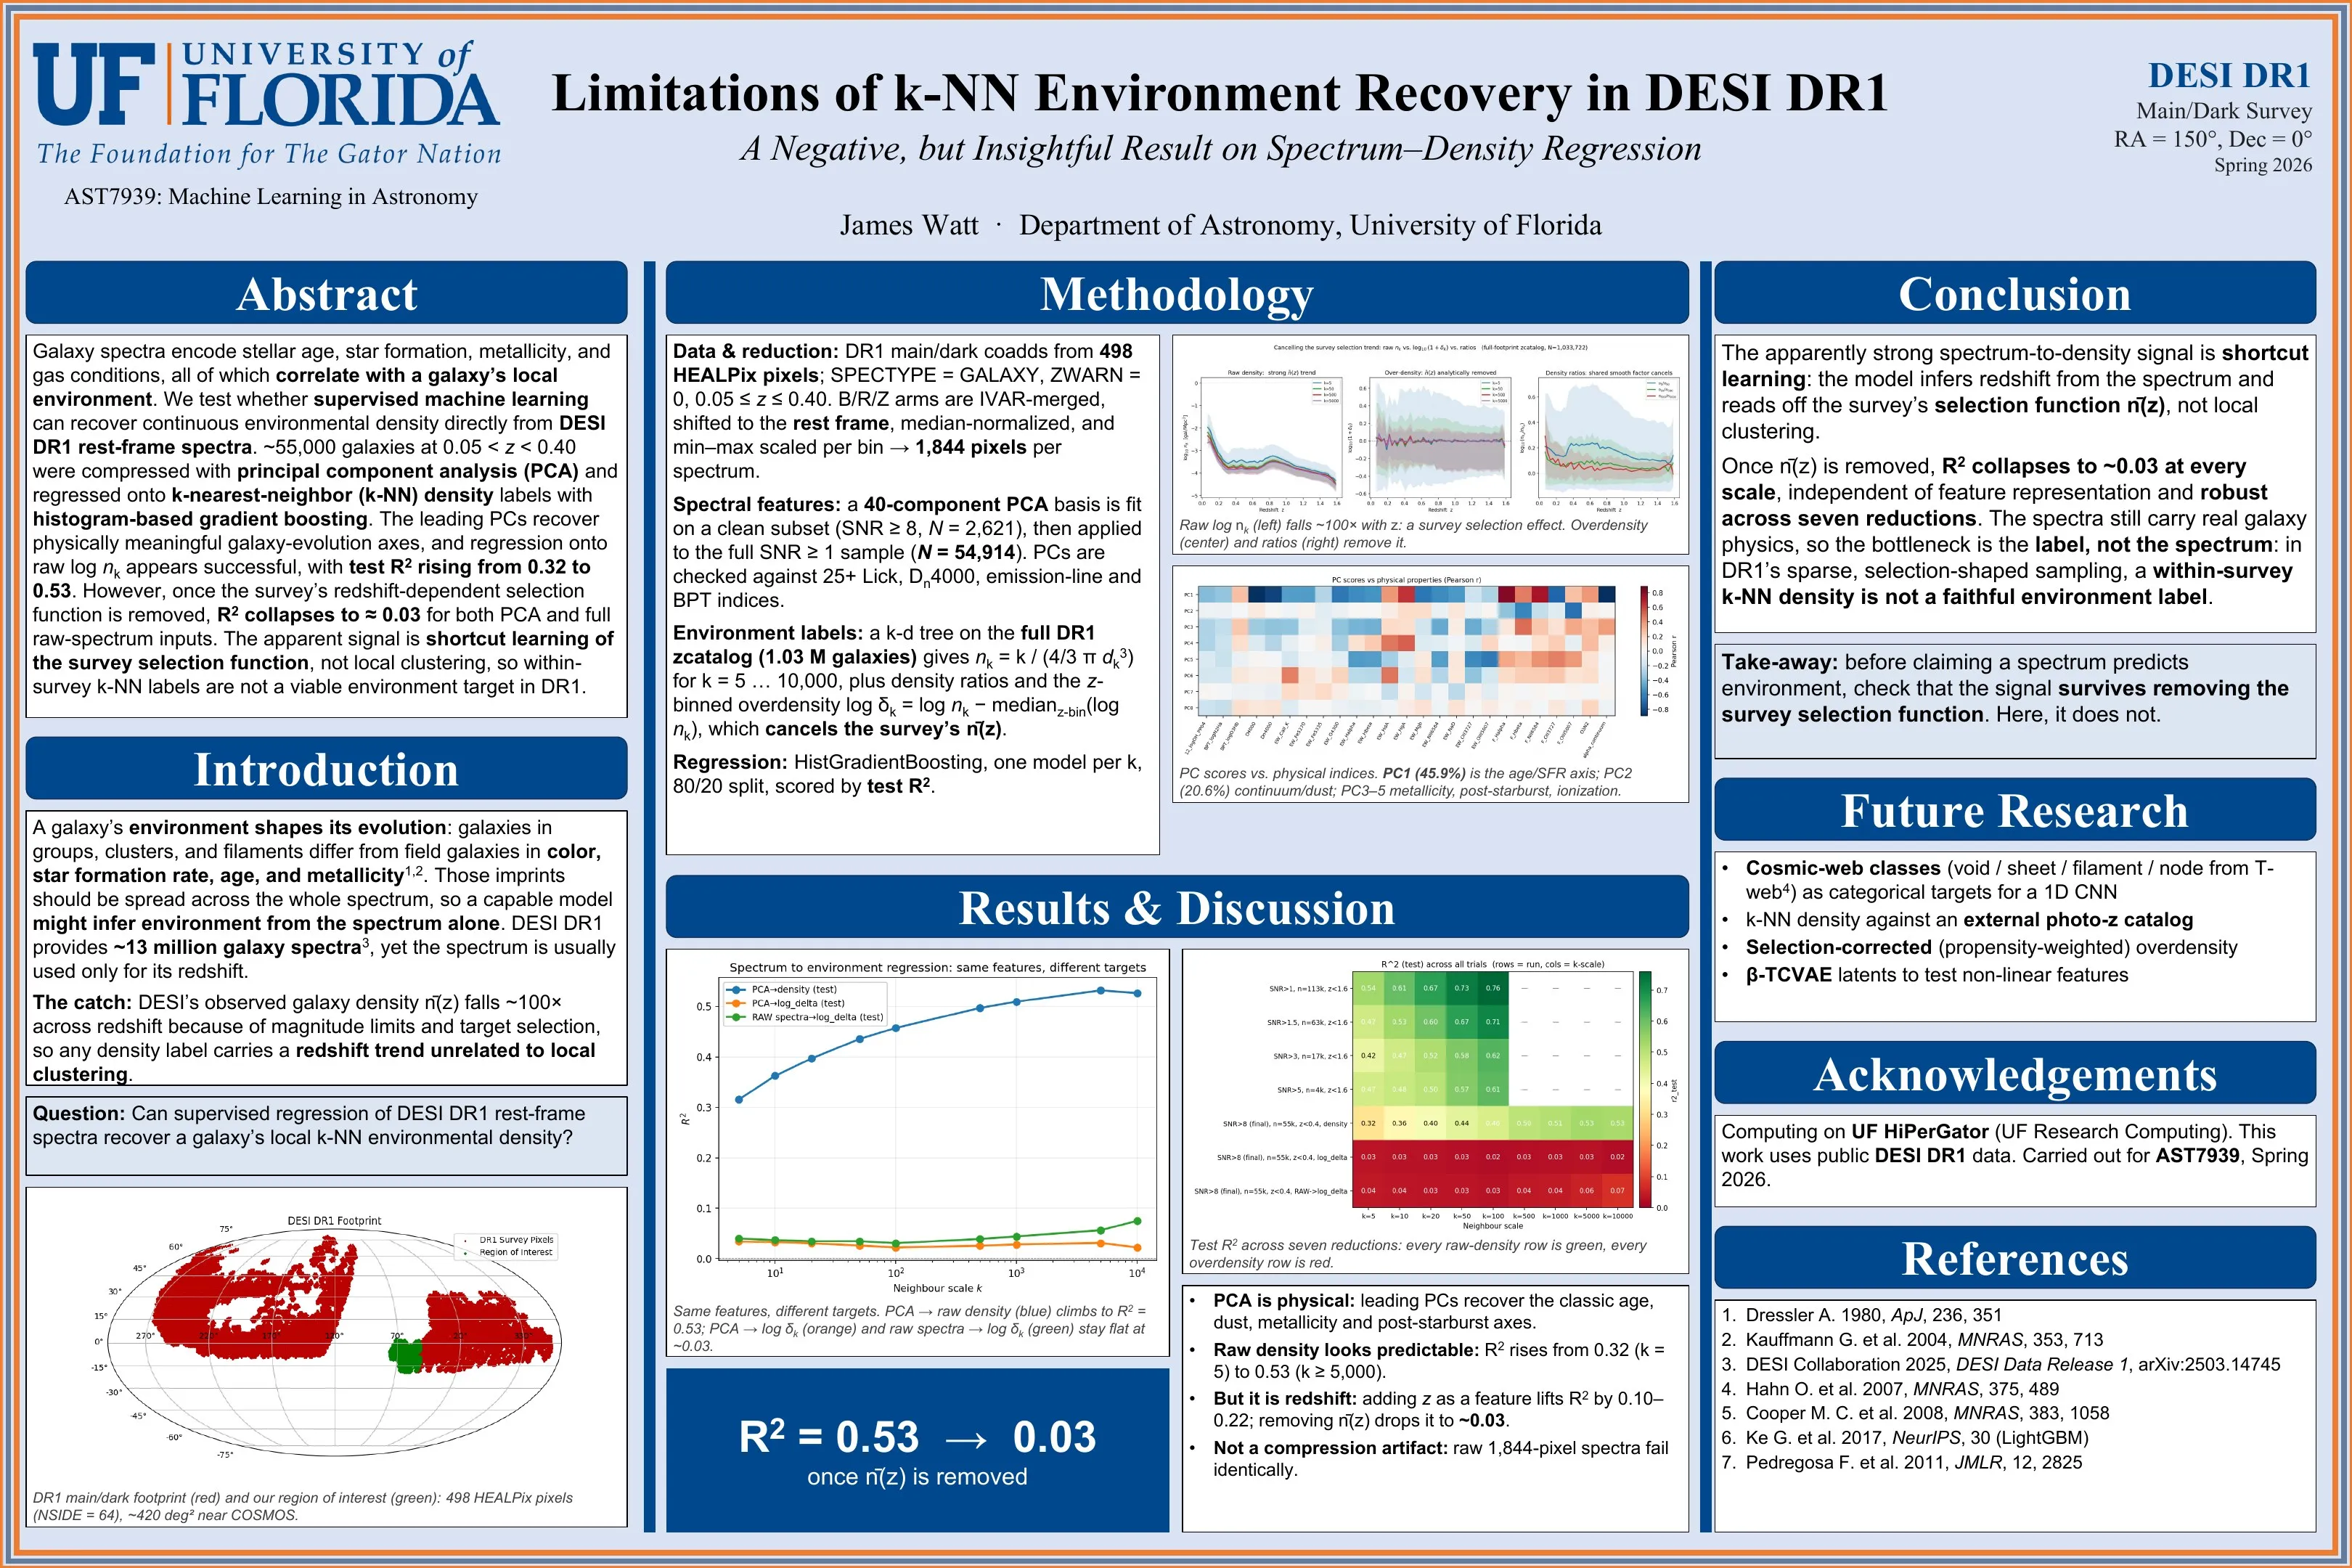
I tested whether machine learning can recover a galaxy's local environment density from its DESI DR1 spectrum. It can't, at least not with within-survey density labels. The apparent signal turned out to be the model learning the survey's redshift selection function.
The question
Galaxies in dense environments (groups, clusters, filaments) differ from isolated ones in almost every observable: they are older, redder, more metal-rich, and less actively star-forming. All of that is written into a galaxy’s spectrum. So, in principle, a spectrum should carry information about where the galaxy sits in the cosmic web.
Environment studies of the Dark Energy Spectroscopic Instrument (DESI) survey use the spectrum only for its redshift and discard the rest. I asked whether supervised regression on full rest-frame spectra could recover a continuous local density, which, as far as I could find, had not been tested on DESI data.
Method
- Data reduction. I selected clean DESI DR1 galaxy spectra (0.05 < z < 0.40, quality and fiber-status cuts), masked bad pixels, merged the three spectrograph arms by inverse-variance weighting, and shifted everything onto a common rest-frame wavelength grid. The regression sample was about 55,000 galaxies drawn from 498 HEALPix pixels.
- Environment labels. For each galaxy I computed k-nearest-neighbor densities at scales k = 5 to 10,000 against the full DR1 redshift catalog (about 1.03 million galaxies). I also computed two versions with the redshift trend removed: a redshift-binned overdensity, and ratios between density scales.
- Representation. I ran PCA on a high signal-to-noise subset. The leading components recover the known physical axes of galaxy variation. PC1 (46% of variance) is the age / star-formation axis and tracks Dn4000, Hδ, and Mg b; PC2 (21%) captures continuum shape and dust; later components track metallicity, Balmer absorption, and ionization state.
- Regression. I used histogram-based gradient-boosted trees (scikit-learn) with held-out test sets and permutation importances, run on UF’s HiPerGator cluster.
Result: a convincing signal that wasn’t real
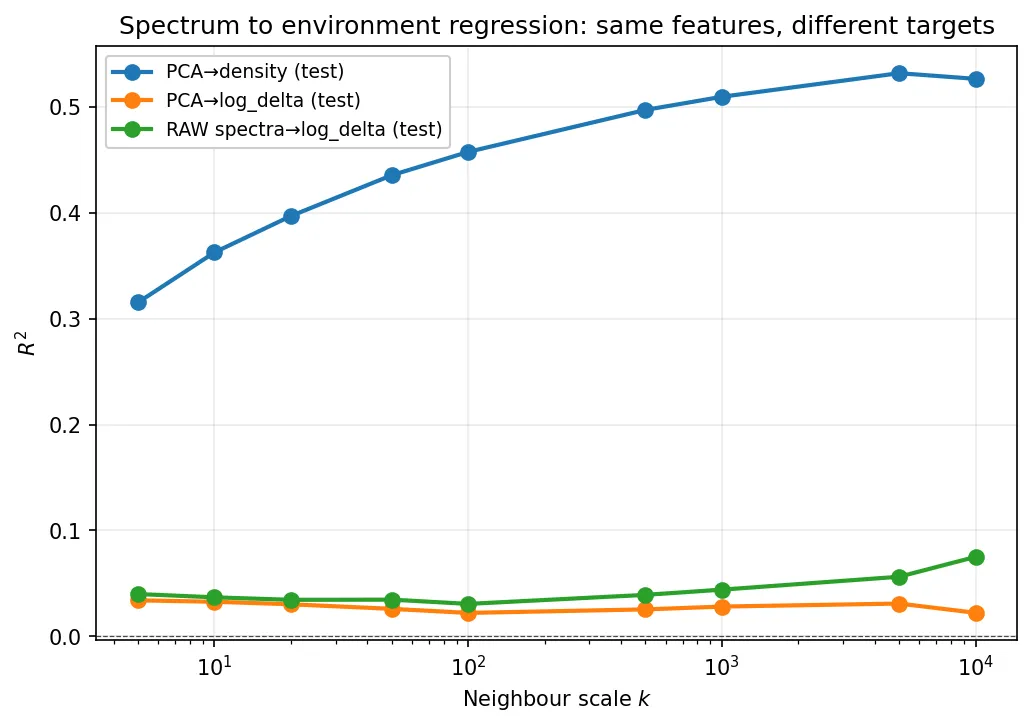
At first, predicting raw density from spectra looked like it worked. Test R² rose steadily from 0.32 at k = 5 to 0.53 at k ≥ 5,000 (blue).
But raw density in a survey falls off with redshift simply because fewer faint galaxies are observed farther away. When I removed that trend and regressed onto redshift-normalized overdensity or density ratios instead, R² collapsed to about 0.03 at every scale (orange). It stayed there even when I fed the model the full 1,844-pixel raw spectra rather than PCA scores (green), which rules out information lost to compression. The result held across seven different data reductions.
The model had learned a shortcut. The spectrum encodes redshift-dependent properties, and the survey’s density falls with redshift, so the regressor recovered the survey’s selection function rather than any real local clustering.
Why it fails, and what would work
The paper traces the null result to four structural causes:
- At DR1’s sampling density, k-NN distances reach tens of Mpc, far larger than the halos and filaments that actually shape galaxy evolution.
- DESI’s fiber assignment is not uniform across environments.
- Density labels built from the same survey inherit its selection effects.
- A continuous density target blurs the distinction between void and cluster galaxies, which may be closer to discrete categories.
Spectrum-to-environment inference will likely need a different kind of label: densities computed from a more complete photometric catalog, an explicitly modeled selection function, group or halo membership, or topological cosmic-web classifications.
Read the paper
The Limitations of kNN Environment Recovery in DESI DR1: A Negative, but Insightful Result on Spectrum–Density Regression
J. Watt · Term project, AST7939 Machine Learning in Astronomy, University of Florida · Spring 2026
Your browser can't show the PDF inline. Open the PDF instead.